Overview
The pandemic and the mass transition to remote work upended long-held norms surrounding how and where work can be done. HRMs had to make quick and effective decisions in highly uncertain scenarios whilst taking over new an unexpected job roles. Compass helps HR in spotting problem areas in their own division, produce contextualised overviews of how employees are working in all the company offices and help decision making processes in uncertain scenarios based on productivity and satisfaction of employees.
Challenge
How can an AI tool help HR manage the workforce,
now that more comfortable working modalities have
been tried and validated, so that employees
can be kept satisfied?
Role
UX Research, wireframing, UI design, user flows, prototyping, usability testing
Tools
Figma
Project Collaborators
4 group members
Year
2022
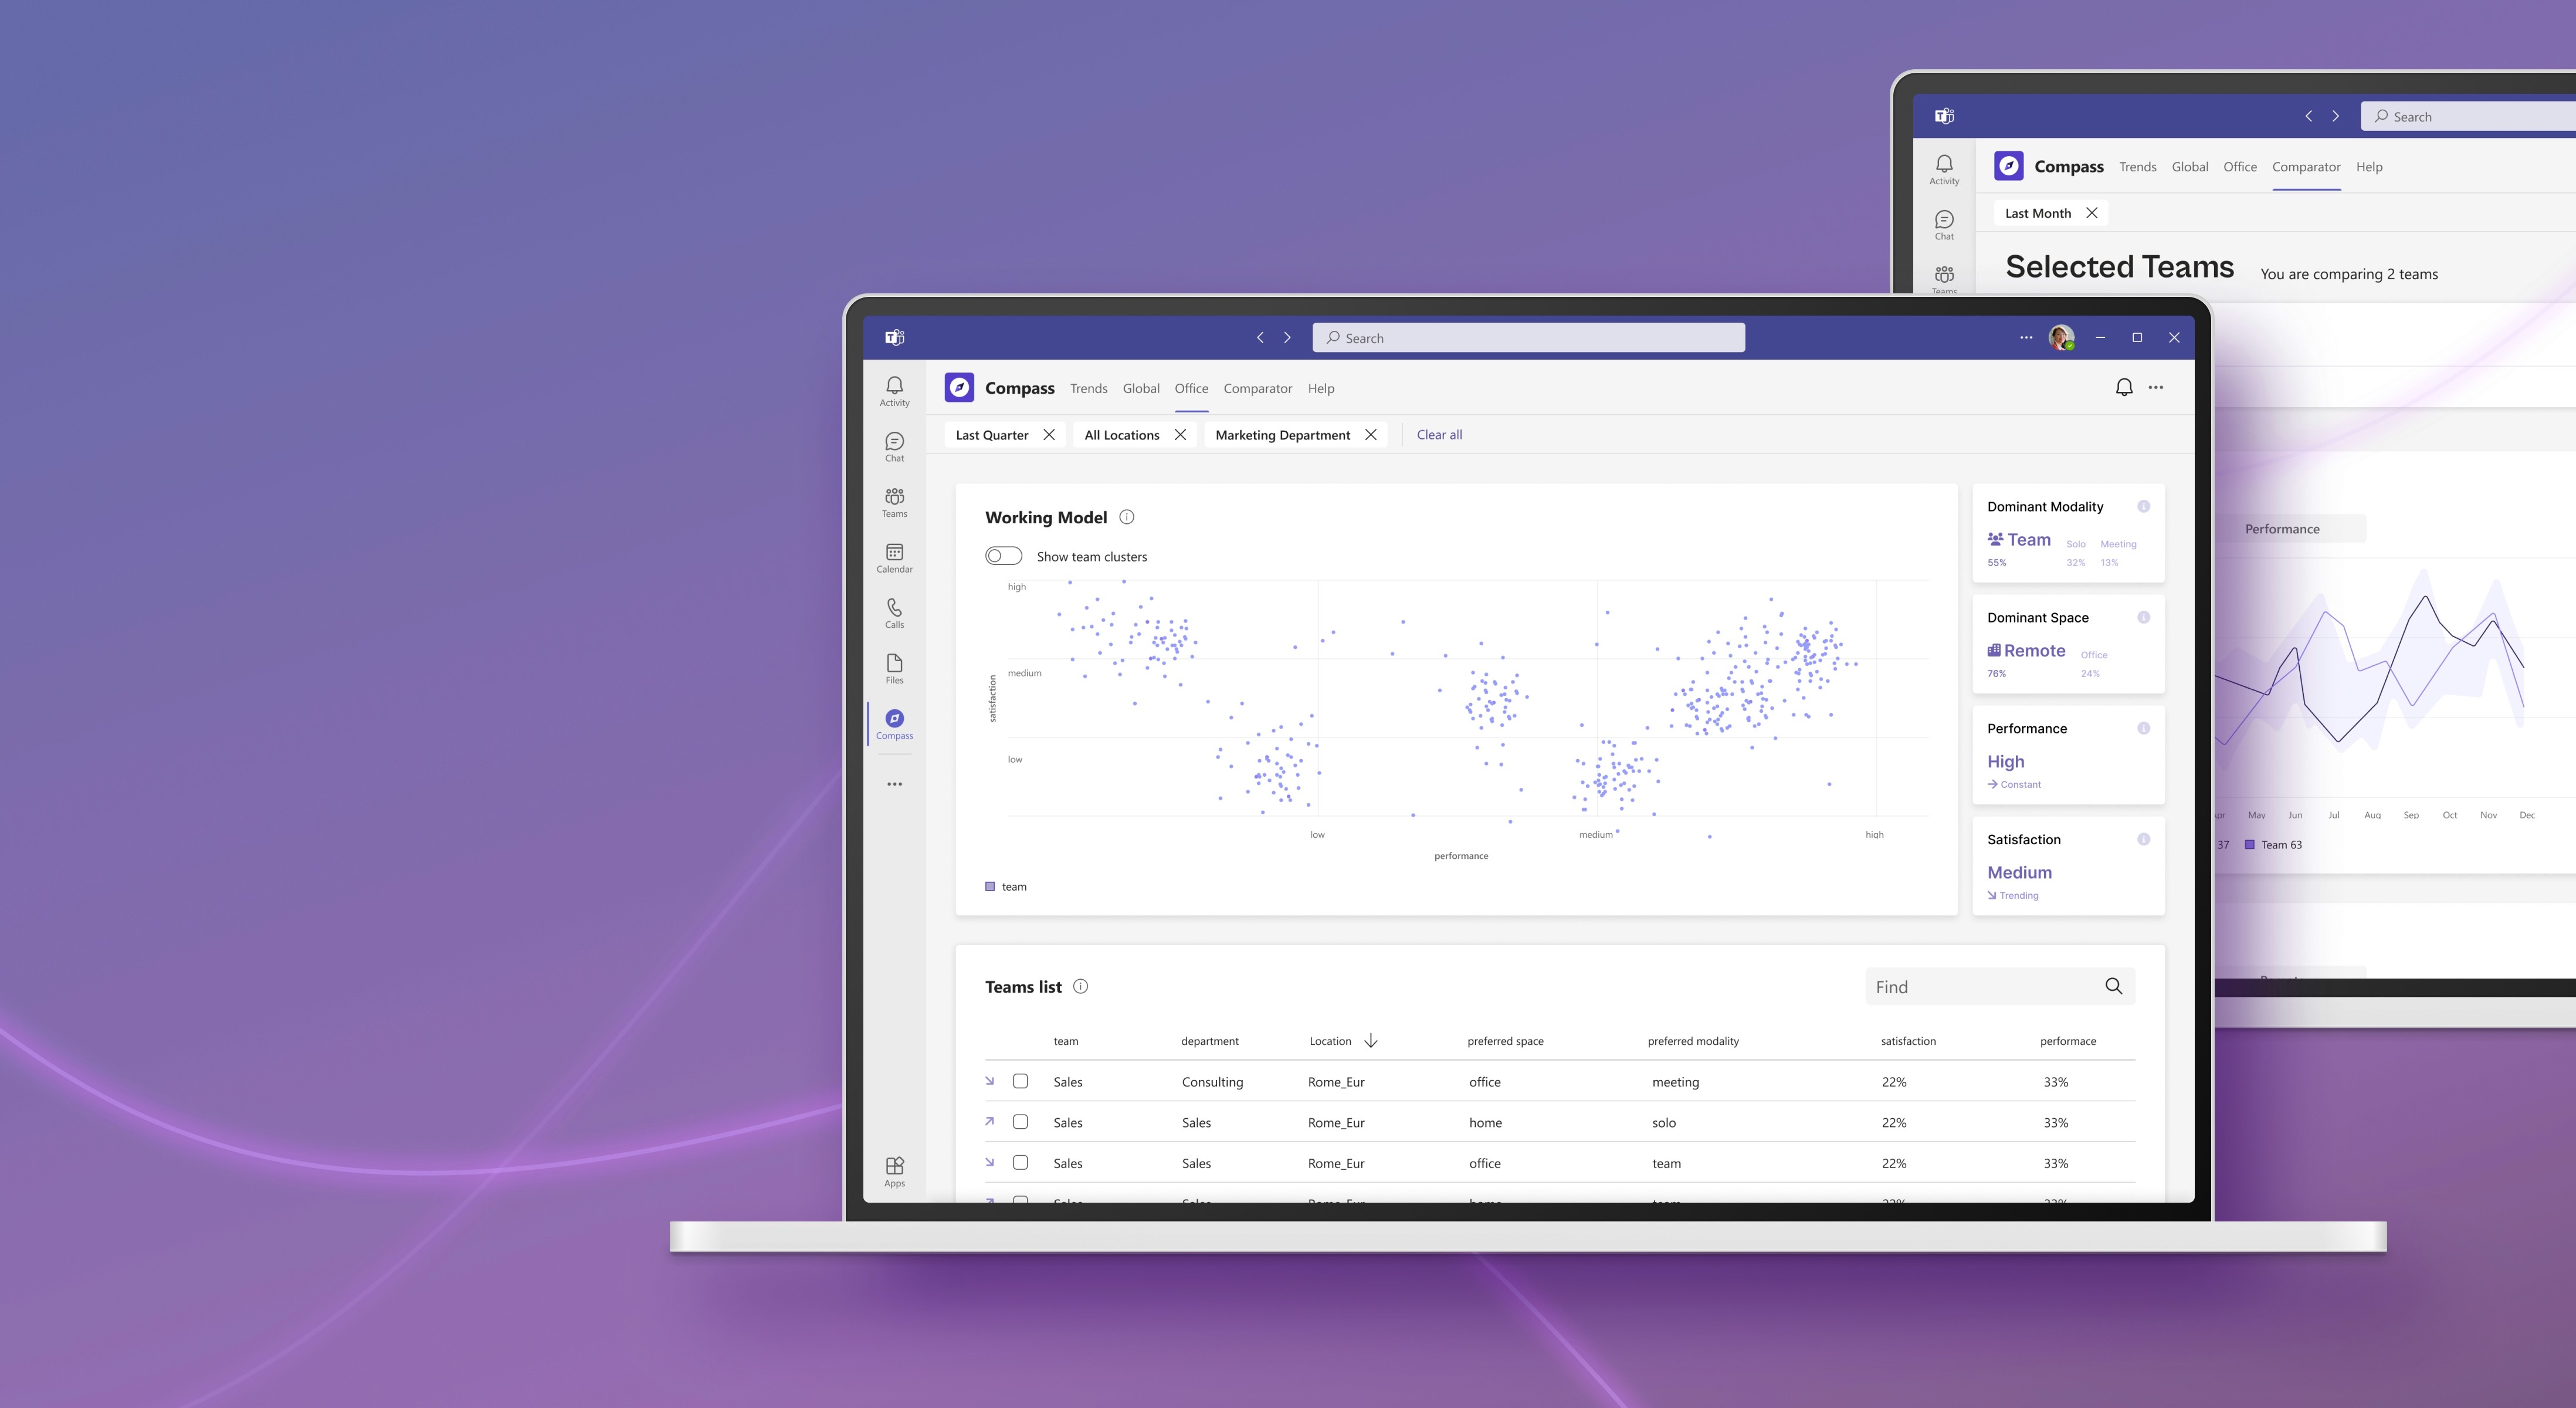
What is Compass?
Compass is a time and space management solution that allows flexibility for employees, thanks to the automation of work schedules production and the creation of analytics for managers to assess satisfaction and performance levels.
Research Outcomes
The starting point for this project was to understand our stakeholders JD before and after pandemic through information presented in literature and stakeholder interviews.
"COVID changed the entire curriculum of work."
- Pakistan-based HR, working for a national design company.

Awareness
HRs now understand requirement and needs of hybrid working modality
Develop multiple wokring modalities
Schedules
Instant customisation to employee schedules emerged as a new requirement
Manage all schedules efficiently
Growth
Employee productivity and satisfaction influence company growth
Keep employees motivated and engaged
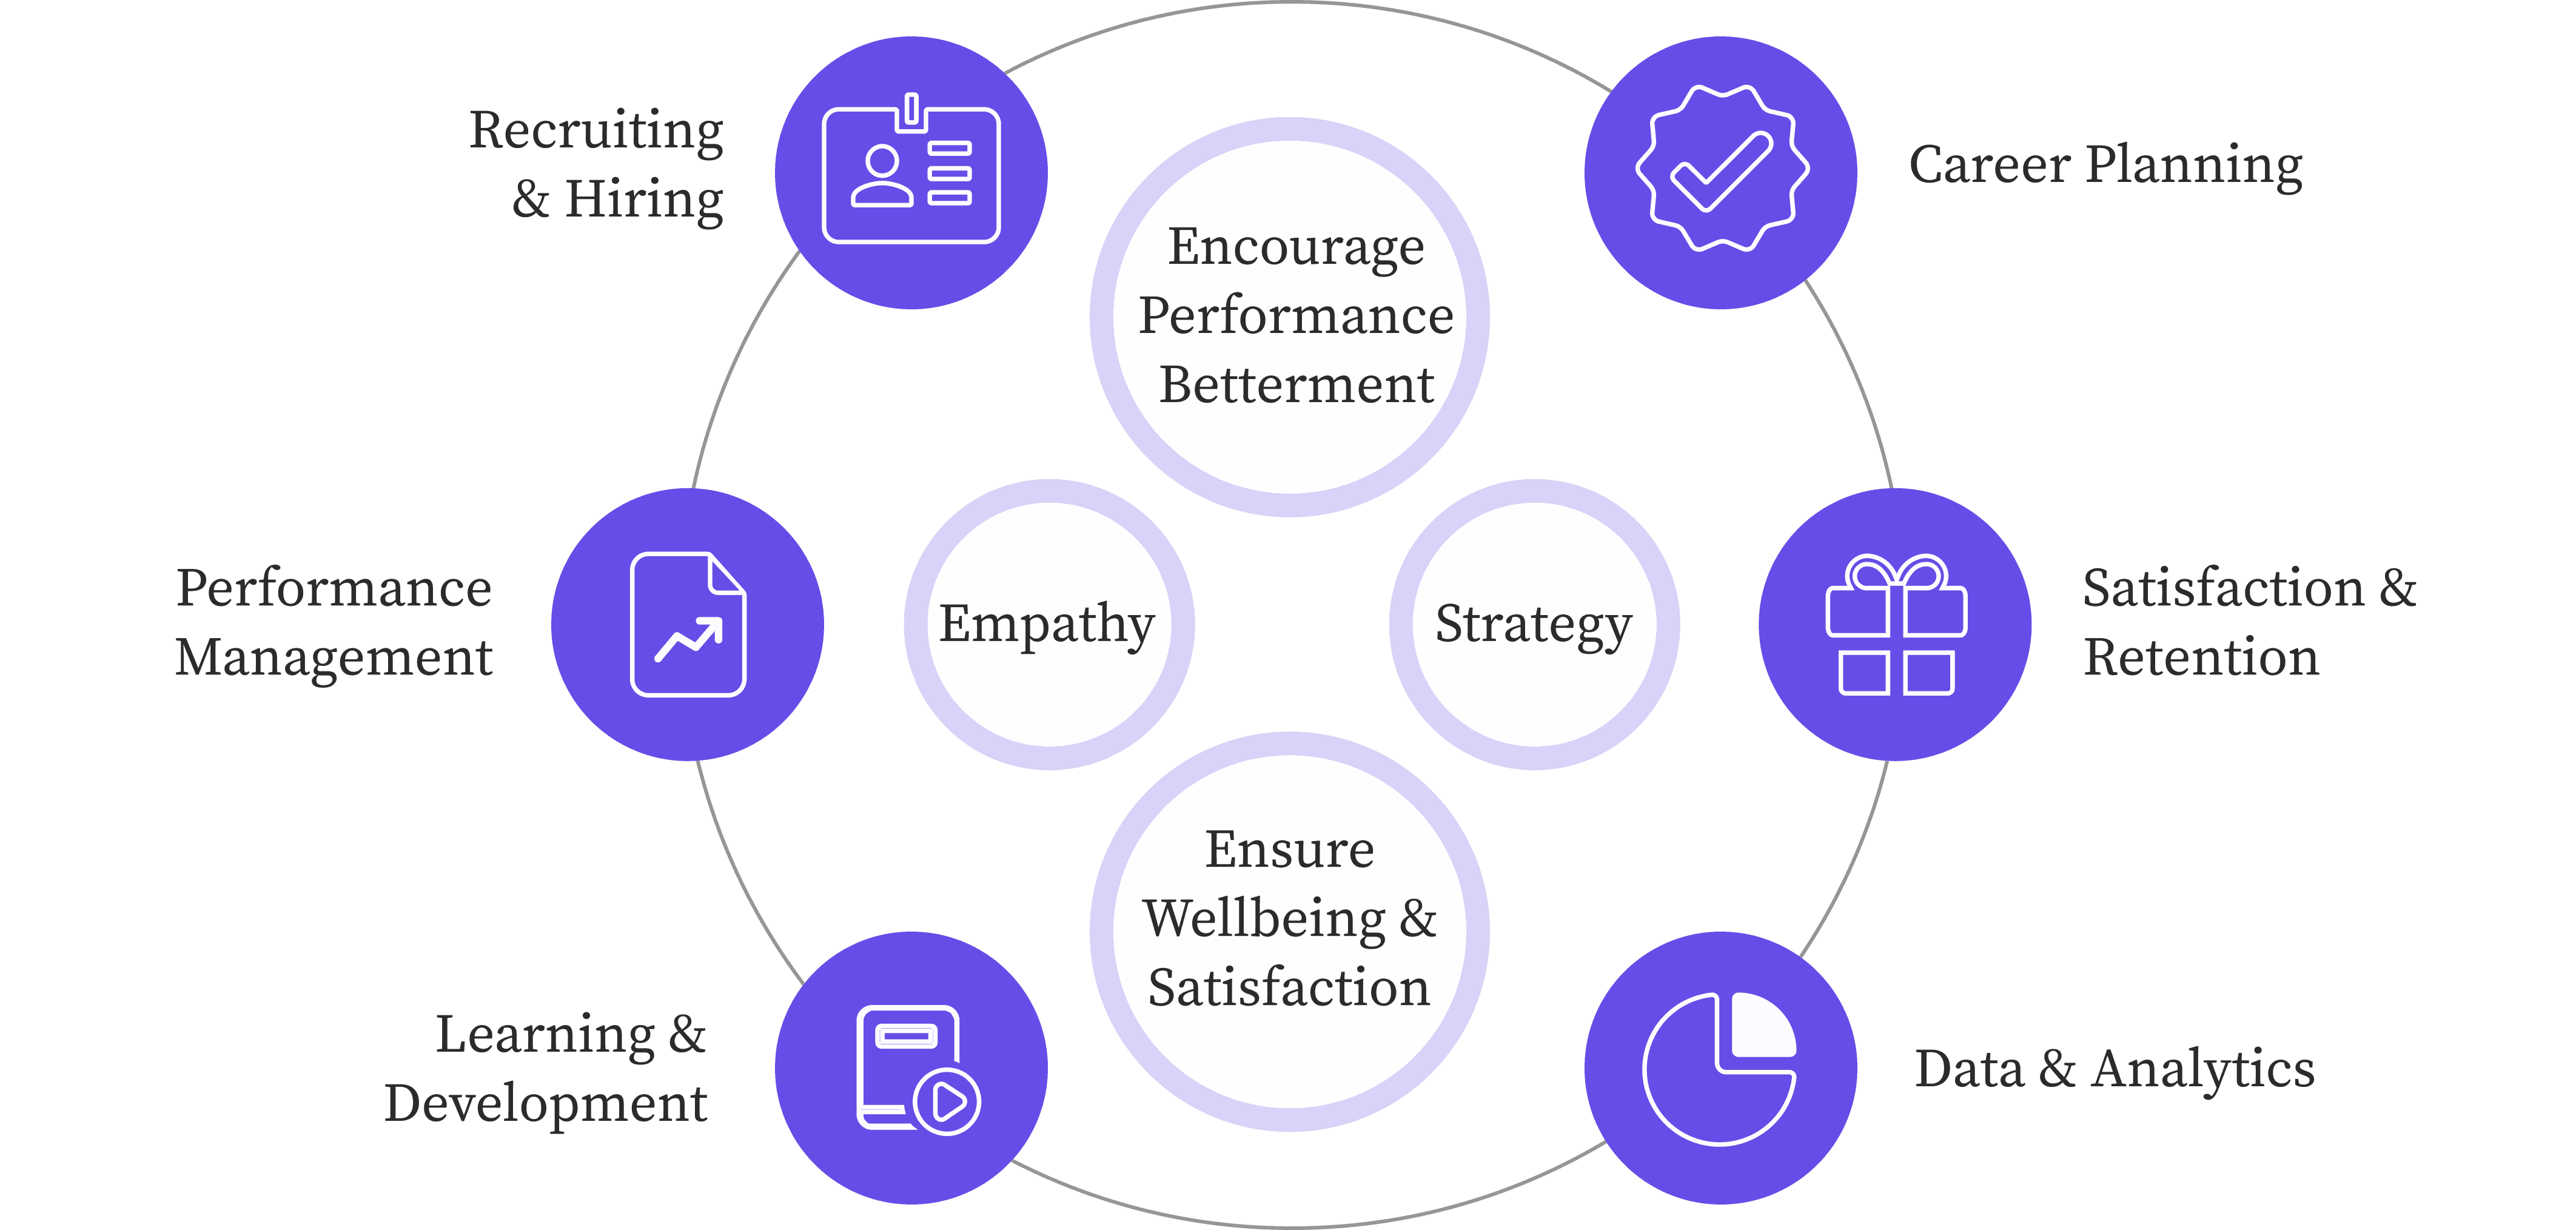
Design Objectives
An AI-powered tool directing the transition to suitable hybrid working models for each company team based on flexible schedules for workers and analytics on space usage, satisfaction and productivity for the manager.
Data and Algorithms
Starting from the values of the stakeholder and the problems that emerged during the research phase, the team formulated a broad series of questions that their stakeholders might have asked themselves and used them as a guide to scout datasets. The following areas of focus were kept in mind when gathering datasets.

Employee data protection
Processing must be done in such a way as to ensure appropriate security. And the data controller should be able to demonstrate GDPR compliance
Need of specific data
Will be collected through pre-existing company database and new data collection startegies.

Company databases
1. Employees ID
2. Contract constraints
3. Offices ID
4. Offices constraints
Schedule data collection
1. Schedules
2. Change requests
Performance and satisfaction
1. Pulse check surveys
2. Achievement for performance
Data Treatment


Prototyping
Agile methodology was adopted by focusing on each element of the dashboard one by one and the team developed the element through quick ideation sprints. This helped in finishing the interface design for both the HR dashboard and the employee dashboard for Compass.
Homepage Graph
This was the synthesised information the HR gets, hence the satisfaction, productivity and working schedules had to be summarised and shown visually in a user friendly interface.


Tool tip
Since different graphs all over the dashboard had to be minimal design yet providing the user with maximum information, the tool tip design played a vital role in improving the user experience.


Filters
Default version of all graphs provided maximum information, however filters were necessary for users to get information contextually when needed.
UI Design Features
Service Design
At this stage we had to define the service dynamics that develop around the ML system core. We started by developing user journeys and a service blueprint to have an overview of users needs and how to better bridge them the solution. Then we gradually defined its form from its most tangible aspects to its intangible dimensions.

Company value network map

Customer Journey
To assess the experience we developed the user journey maps of the two users. We defined the goals of the HRs and the employees and broke them down into the steps needed to achieve it, to understand needs and pains at every step. To better visualise the detailed CJMs we created storyboards for each of the users.
HRM

Employee

Service Blueprint
Since the team was dealing with a socio-technical system, they referred to the the O2O Service blueprint,(Ryua, D., Limb, C., Kim, K. 2020) to visualise and analyse the relationships between the online and offline service processes. Starting from the user journeys of the two users, the team identified the main flow of user actions and started developing the needed channels for supporting online and offline interactions.

Project Report
Read through the process in detail including the in depth understanding of the algorithms, service, concept and problem solving techniques.
View other works
Let's work together!